SRG Fibs SmoothedPLEASE READ: HOW TO UNDERSTAND HOW THIS INDICATOR WORKS FOR ME!
Why did I code this?
I never know where is the best place to buy
Sometimes I get greedy and just don't want to sell...
I want to protect myself from losses and still be able to make some trades
What does this do?
This script plots Fibonacci levels dynamically according to a specified length
It also has a smooting value so it looks a bit more clean (and allows for dynamic trailing stop loss)
Internal Fib levels allow to plot fibonacci levels between each main level (scalpers and day traders should be happy with this)
Fib Projection toggle so we can have "the same behaviour" during aggressive Bull Runs.
How to test this thing?
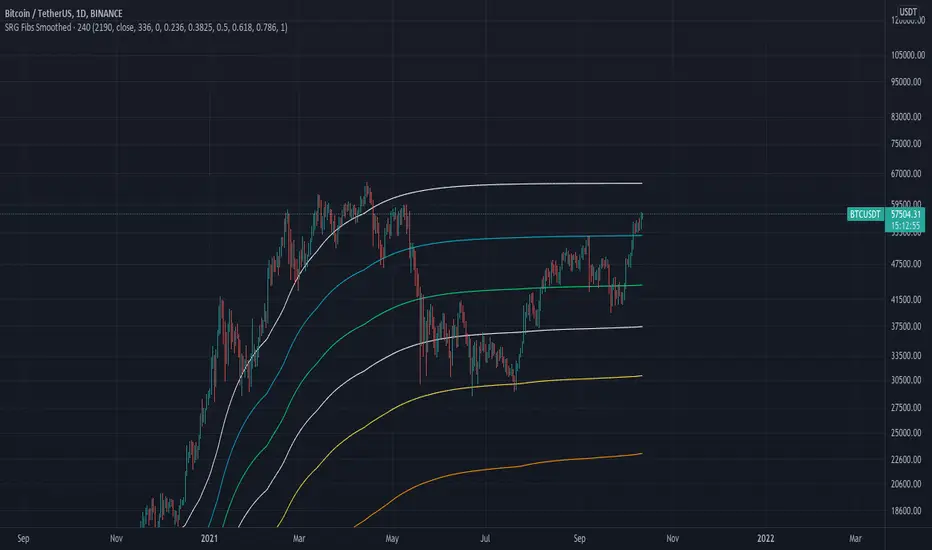
BTC USD Daily chart
For starters, use the following settings:
- Length: 365 (lookback of a full year)
- Smooth: 56 (8 week period)
- Inter Fib levels: OFF
- Fib projection: OFF
Have a look into the chart and check some support/resistance zones. Also check the behaviour of the indicator during the 2021 Jan -> Mar bull run (we will need it later)
If you like to check different time frames. Use these settings:
- Indicator Timeframe: 4 hours
- Length: 2190 (1 year)
- Smooth: 336 (8 weeks)
- Inter Fib Levels: ON
- Fib Projection: OFF
You can now test the chart using the 2H timeframe to see the movement, and how the Internal Fib levels work
Now as we're getting bullish:
- Indicator Timeframe: 4 hours
- Length: 2190 (1 year)
- Smooth: 336 (8 weeks)
- Inter Fib Levels: OFF
- Fib Projection: ON
You can now check the behaviour of the indicator during the 2021 Jan - Mar Bullrun in the 2H or 4H chart, to see some stop loss magic.
Komut dosyalarını "stop loss" için ara
Ticker SummaryTicker Summary provides at-a-glance summary information about a ticker near the current bar on the chart:
P/E ratio
Fwd P/E ratio
PEG ratio
Floating shares vs. total shares outstanding
% of trading volume that was short over the last 3 days
Average True Range (ATR) over last 14 days
There are a few less common items of information:
How many ATR multiples the ATR is extended over the last 10 bars. This gives an idea of how far the stock is currently extended.
"R-frequency", explained below.
An optional "ATR Reticule" is shown near the price. This is useful for traders that use ATR as a guideline for price targets and stop losses. On the left is the # of ATRs the stock is currently above the session open. On the right is the # of ATRs the stock is extended above the 10-bar moving average.
R-frequency: a measure of liquidity relevant to your own trading size. It is the frequency at which 1-R of your trading account is traded for a stock. Formula:
(1-R worth of shares) / (average dollar value traded per second), where:
"1-R worth of shares" is how many shares you would buy for a stop loss of -1 ATR, with max risk dollar value based on the Balance and Max Risk % indicator options.
"Average dollar value traded per second" is the 14-day average of (avg(high, low and close) * daily volume)
R-frequency of a second or less is very liquid. If the value is higher (for example, over 60 seconds) the stock is less liquid and you may have some trouble filling limit orders quickly.

TradePro Parabolic SAR BackgroundTradePro Parabolic SAR Background
This indicator is a small tribute to youtuber TradePro
The operation is simple. It is the same Parabolic SAR indicator with its default configuration, but in background format. It is a new way to visualize the same information, more understandably. It is in itself a complete trading system, it can be used in conjunction with the traditional Parabolic SAR to locate the stop loss.
Parabolic SAR
In stock and securities market technical analysis, parabolic SAR (parabolic stop and reverse) is a method devised by J. Welles Wilder, Jr., to find potential reversals in the market price direction of traded goods such as securities or currency exchanges such as forex. It is a trend-following (lagging) indicator and may be used to set a trailing stop loss or determine entry or exit points based on prices tending to stay within a parabolic curve during a strong trend.
Similar to option theory's concept of time decay, the concept draws on the idea that "time is the enemy". Thus, unless a security can continue to generate more profits over time, it should be liquidated. The indicator generally works only in trending markets, and creates "whipsaws" during ranging or, sideways phases. Therefore, Wilder recommends first establishing the direction or change in direction of the trend through the use of parabolic SAR, and then using a different indicator such as the Average Directional Index to determine the strength of the trend.
A parabola below the price is generally bullish, while a parabola above is generally bearish. A parabola below the price may be used as support, whereas a parabola above the price may represent resistance.

Supertrend with Percent Difference from CloseThis script improves the Supertrend indicator by displaying a label that shows the percent difference between the latest closing price & the Supertrend.
This comes in handy when one is using the Supertrend value as a stoploss level. For instance, one would like to have a maximum stop loss level of 8%. Instead of calculating how much percent the price is away from the Supertrend, one can look at the percent label & make an informed decision as to whether initiating a position would have favourable risk/reward or not.
Another utility would be selling into strength when one is using the Supertrend as a trailing stop loss. For instance, if the price is a certain percentage far away from the Supertrend, one may conclude that the price is now extended & either price correction or time correction would ensue, & decide to sell into strength.

Tipsy EMA Tipsy EMA
v0.2a
Coded by vaidab.
A simple strategy to buy dips in an uptrend.
How to use:
- buy on trend when price retraces to the orange "buy" line and compound orders
- sell when price reaches red line (stop loss) or at 💰 (take profit)
Note that you can reverse trade on the 💰 sign for a short scalp / day trade.
Uptrend: green/red background. Danger zone: orange bg. No go zone: no bg.
Potential buys (in a clear trend): 55, 100, 200 EMA touches and
fibo retracements to .382 and .618.
Potential stop loss: when price breaks the 200 EMA (marked by a red line).
Exit signs: opposite trend divergences (RSI).
Take profit: EMA 55 crossing down EMA 100.
Use it in confluence with market structure. E.g. If 200 EMA ligns up with
past market structure, if there are whole numbers or if there's a monthly level.
Tested BTCUSDT D, 4H

Relative VolumeVolume can be a very useful tool if used correctly. Relative volume is designed to filter out the noise and highlight anomalies assisting traders in tracking institutional movements. This tool can be used to identify stop loss hunters and organized dumps. It uses a variety of moving averages to hide usual activity and features an LSMA line to show trend. Trend columns are shown to highlight activity and can be seen at bottom of the volume columns, this is done using ZLSMA and LSMA.
The above chart shows an example of 2 indicators being used on the 15 min chart. The bottom indicator is set to the 1 min chart. Traders can see a large dump on the 1 min chart as institutions wipe out any tight stop losses. Next they buy back in scooping up all those long positions.
This is an example layout using a split screen setup and multiple timeframes ranging from 1 min to 30 mins. This gives a clear indication of trends and make it easy to pickup on institutional behaviour. Tip: Double clicking indicator background will maximize RVOL to the split screen window.

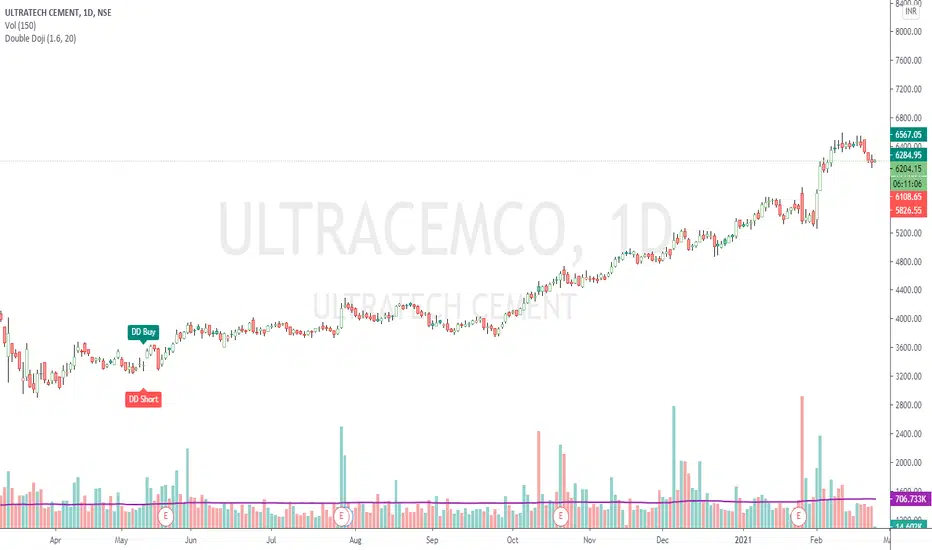
Double DojiStrategy Kiss = 'Keep It Simple, Stupid' or 'Keep It Simple, Smart'
The script simply identifies 2 consecutive Doji candles, and calculates Target on both the sides for given Reward : Risk factor.
The High-Low to Open-Close ratio is set to default value 20. The Reward : Risk ratio is of default value 2.
Both can be set to values of your choice.
Accuracy best on Daily chart. Can be tried on any timeframe though.
Trading Rules: Buy at higher / Short at lower of the 2 candles, with other as Stop Loss.
If a Stop Loss is hit, go for reverse trade. If again a SL is hit, switch to other instrument.
Important: If trading in Futures and target is achieved, hedge the position by buying an option (subject to liquidity).
Reason is, the trend may condition to any extent and you would definitely not want to miss out the whole action.
Check the shared example. For a risk to 175 points, reward is 2200+ points (more than 12.5 times).
Forex Scalp Triggersthe triggers only work to tell you go back 5 candles on 5 min, take either lowest or highest plus 3 pips and make entry and go 3 pip over under trigger for stop loss. can take half profit at 1x and move stop to break even and go 1x more for take rest profit, or create a trailing stop loss on Take Profit level 2 and ride the trend.
1 Hour chart has to be over under the emas that are faned out nicely to move to 5 min chart to look for the signals if 1hr chart isnt over under the emas nicely then NO TRADE
ForexSignalTV helped create this strategy, just my first script so learning, want to take it to next level but kind of stuck for now. More knowledge coming...
inwCoin Percent from all-time highSimple study to show the fact to some newbies in the market that it is VERY HARD to make a profit and get your portfolio back to all-time high if you don't know how to stop loss...
Some people think "Oh, ez if you down -90% you need only +90% to get 100% of your capital again"
But... actually....if your portfolio down -90% you need to go 1000% from current price to reach your start capital!!!!
This study will show
- Current symbol detail
- Percent down from All-time High ( ATH )
- Percent up from current price to reach ATH again

Profit and Stoploss CalculatorThis script is designed to display three stop loss areas to assist either with automation of risk management or identify and alert when price is in a range of a trade for risk to reward ratio.
In this version there are three stop losses and 1 PT. Mainly because i will most likely only be using 1 of the SL to pair with the PT.
Stoploss areas are displayed on both sides of the price for long and short calculations along with the two profit factors but the settings in the indicator it self apply to both sides in terms of percentage.

Dashboard EMA Unifié [touli]DISCLAIMER
This indicator is provided for educational and informational purposes only. It does not constitute investment advice, a recommendation to buy or sell, or a solicitation for any transaction. Past performance is not indicative of future results. Trading involves significant risk, including the potential loss of capital. The user assumes full responsibility for their own trading decisions and risk management. The author of this script cannot be held liable for any losses or damages resulting from its use.
Indicator Title: Unified EMA Dashboard
Overview
This indicator is a comprehensive technical analysis tool that combines the display of Exponential Moving Averages (EMAs) on the chart with a multi-timeframe dashboard. It is designed to provide traders with a quick and clear overview of the trend across multiple timeframes, while also providing visual cues directly on the current chart.
Key Features
Multi-Timeframe Dashboard: Displays a clean and concise table showing the price's position relative to four different EMAs (9, 21, 50, 200) across 6 timeframes (from 1 minute to 1 day).
A blue arrow ▲ indicates that the closing price is above the EMA (potential bullish trend).
A red arrow ▼ indicates that the closing price is below the EMA (potential bearish trend).
Display of 4 EMAs on the Chart:
EMA 9 & 21: Plotted on the current timeframe, they help identify the very short-term trend.
EMA 50 (from the 5m TF) & EMA 200 (from the 15m TF): Plotted on the current chart but calculated on higher timeframes. They offer a perspective on the stronger, underlying trends.
Full Customization: The indicator's settings allow the user to:
Modify the periods of the four EMAs.
Choose the dashboard's position on the screen.
Change the dashboard's theme (Dark or Light).
Enable or disable the display of the EMAs on the chart.
Optimized Code: The script is designed for performance, drawing and calculating the dashboard only on the last available price bar, thus avoiding chart lag.
How to Use
1. Installation
On TradingView, open the chart of your chosen asset.
At the bottom of the screen, click on the "Pine Editor" tab.
Copy the entire corrected script and paste it into the editor, replacing any existing content.
Click the "Add to Chart" button. The indicator will then appear on your chart.
2. Configuration
Click the gear icon (⚙️) next to the indicator's name to access its settings.
General Settings:
Dashboard Theme: Choose "Dark" or "Light" for better readability depending on your chart's color scheme.
Dashboard Position: Select where you want the dashboard to appear (e.g., "Bottom Right," "Top Left," etc.).
EMA Settings:
Modify the periods (9, 21, 50, 200) if you prefer to use other values for your analysis.
Chart Display Settings:
Check or uncheck the boxes to show or hide the EMA lines on your main chart. For instance, you can disable the lines and only use the dashboard.
3. Interpretation (For Informational Purposes)
The Dashboard:
Confluence Analysis: The dashboard's main strength is identifying trend "confluence." A column that is entirely blue (▲) or red (▼) suggests a strong, aligned trend across multiple time scales.
Identifying Reversal Points: If the shorter timeframes (1m, 5m) start to change color while the longer ones (4h, 1D) remain stable, this may indicate a pullback or the beginning of a trend change.
The EMAs on the Chart:
Dynamic Support and Resistance: The EMA lines can act as areas of support in an uptrend and resistance in a downtrend.
Underlying Trend: The price's position relative to the longer-period EMAs (50 and 200) gives an indication of the general underlying trend.
Best Practices and Limitations
Do Not Use in Isolation: This indicator is a trend confirmation tool. It is recommended to use it in conjunction with other analysis tools (volume, market structure, other indicators).
Lagging Indicator: Moving averages are trend-following indicators, which means they react to past price movements. They do not predict future movements.
Risk Management: Always set a stop-loss and take-profit for every trade. Never risk more than a small percentage of your capital on a single position.

Gann Octave 8 - Professional V 1.0Gann Octave 8 Indicator:
Core Concept: This indicator divides the price range between highest high and lowest low into 8 equal parts (octaves), creating support/resistance levels based on W.D. Gann's trading principles.
Key Components:
1. Price Range Calculation:
o Finds highest high and lowest low over a lookback period (default 50 bars)
o Divides this range into 8 equal segments (12.5% each)
2. 8 Octave Levels:
o 0% (Low Support) - Strongest support
o 12.5%, 25%, 37.5% - Minor levels
o 50% (CRITICAL) - Most important level
o 62.5%, 75%, 87.5% - Minor levels
o 100% (High Resistance) - Strongest resistance
3. Gann Angles: Projects trend lines from high/low points at various angles (1x1, 2x1, 1x2, etc.)
4. Visual Features:
o Color-coded levels
o Information table showing current position
o Background highlighting when near critical levels
o Trend analysis (bullish/bearish zones)
Trading Strategy
Entry Signals:
BULLISH TRADES:
• Price crosses above 50% level → Strong buy signal
• Price bounces from 25% or 37.5% levels → Support bounce
• Price in upper zone (above 50%) → Bullish bias
BEARISH TRADES:
• Price crosses below 50% level → Strong sell signal
• Price rejects at 75% or 87.5% levels → Resistance rejection
• Price in lower zone (below 50%) → Bearish bias
Key Trading Rules:
1. 50% Level is Critical: Most important for trend direction
2. Zone Trading:
o Above 50% = Bullish zone (look for longs)
o Below 50% = Bearish zone (look for shorts)
3. Strength Levels:
o Above 75% or below 25% = Strong moves
o Near 100% (high) or 0% (low) = Extreme levels
Risk Management:
• Stop Loss: Place below previous octave level
• Take Profit: Target next octave level
• Position Size: Reduce size near extreme levels (0%, 100%)
Example Trade:
If price breaks above 50% level:
• Entry: Long position
• Stop: Below 37.5% level
• Target: 75% level
• Risk: Monitor for rejection at resistance levels
The indicator works best in trending markets and helps identify high-probability reversal zones.
Works for both Stocks & Derivatives. Experiment with code and share your feedback in comments..

Future is hereOverview
"Future is Here" is an original, multi-faceted Pine Script indicator designed to provide traders with a comprehensive toolset for identifying high-probability trading opportunities. By integrating volatility-based entry zones, trend-based price targets, momentum confirmation, dynamic support/resistance levels, and risk-reward ratio (RRR) calculations, this indicator offers a cohesive and actionable trading framework. Each feature is carefully designed to complement the others, ensuring a synergistic approach that enhances decision-making across various market conditions. This script is unique in its ability to combine these elements into a single, streamlined interface with clear visual cues and customizable alerts, making it suitable for both novice and experienced traders.
Key Features and How They Work Together
Volatility-Based Entry Zones
Purpose: Identifies overbought and oversold conditions using a volatility-adjusted moving average, helping traders spot potential reversal zones.
Mechanism: Utilizes a user-defined volatility length and multiplier to calculate dynamic overbought/oversold thresholds based on the standard deviation of price. Crossovers and crossunders of these levels trigger "Buy Zone" or "Sell Zone" labels.
Synergy: These zones act as the foundation for entry signals, which are later confirmed by momentum and trend filters to reduce false signals.
Trend-Based Price Targets
Purpose: Projects potential price targets based on the prevailing trend, giving traders clear objectives for profit-taking.
Mechanism: Combines a fast and slow moving average to determine trend direction, then calculates target prices using a multiplier of the price deviation from the slow MA. Labels display bullish or bearish targets when the fast MA crosses the slow MA.
Synergy: Works in tandem with entry zones and momentum signals to align targets with market conditions, ensuring traders aim for realistic price levels supported by trend strength.
Momentum Confirmation
Purpose: Validates entry signals by assessing momentum strength, filtering out weak setups.
Mechanism: Uses the momentum indicator to detect bullish or bearish momentum crossovers, labeling them as "Strong" or "Weak" based on a comparison with a smoothed momentum average.
Synergy: Enhances the reliability of buy/sell signals by ensuring momentum aligns with volatility zones and trend direction, reducing the risk of premature entries.
Dynamic Support/Resistance Levels
Purpose: Highlights key price levels where the market is likely to react, aiding in trade planning and risk management.
Mechanism: Detects pivot highs and lows over a user-defined lookback period, drawing horizontal lines for the most recent support and resistance levels (limited to two each for clarity). Labels mark these levels with price values.
Synergy: Complements entry zones and price targets by providing context for potential reversal or continuation points, helping traders set logical stop-losses or take-profits.
Buy/Sell Signals with Risk-Reward Ratios
Purpose: Generates precise buy/sell signals with integrated take-profit (TP), stop-loss (SL), and RRR calculations for disciplined trading.
Mechanism: Combines volatility zone crossovers, trend confirmation, and positive momentum to trigger signals. ATR-based TP and SL levels are calculated, and the RRR is displayed in labels for quick assessment.
Synergy: This feature ties together all previous components, ensuring signals are only generated when volatility, trend, and momentum align, while providing clear risk-reward metrics for trade evaluation.
Customizable Alerts
Purpose: Enables traders to stay informed of trading opportunities without constant chart monitoring.
Mechanism: Alert conditions are set for buy and sell signals, delivering notifications with the entry price for seamless integration into trading workflows.
Synergy: Enhances usability by allowing traders to act on high-probability setups identified by the indicator’s combined logic.
Originality
"Future is Here" is an original creation that distinguishes itself through its holistic approach to technical analysis. Unlike single-purpose indicators, it integrates volatility, trend, momentum, and support/resistance into a unified system, reducing the need for multiple scripts. The inclusion of RRR calculations directly in signal labels is a unique feature that empowers traders to evaluate trade quality instantly. The script’s design emphasizes clarity and efficiency, with cooldowns to prevent label clutter and a limit on support/resistance lines to maintain chart readability. This combination of features, along with its customizable parameters, makes it a versatile and novel tool for traders seeking a robust, all-in-one solution.
How to Use
Setup: Add the indicator to your TradingView chart and adjust input parameters (e.g., Volatility Length, Trend Length, TP/SL Multipliers) to suit your trading style and timeframe.
Interpretation:
Look for "Buy Zone" or "Sell Zone" labels to identify potential entry points.
Confirm entries with "Bull Mom" or "Bear Mom" labels and trend direction (Bull/Bear Target labels).
Use Support/Resistance lines to set logical TP/SL levels or anticipate reversals.
Evaluate Buy/Sell signals with TP, SL, and RRR for high-probability trades.
Alerts: Set up alerts for Buy/Sell signals to receive real-time notifications.
Customization: Fine-tune multipliers and lengths to adapt the indicator to different markets (e.g., stocks, forex, crypto) or timeframes.

ATR Display ShorcutATR Value Display - On-Chart Volatility Monitor
Clean ATR display directly on your price chart - no extra panels needed!
This indicator displays the current Average True Range (ATR) value as a clean table overlay on your price chart, eliminating the need for a separate indicator panel below your main chart.
✨ Key Features:
On-chart display: ATR value shown directly on price chart
Customizable positioning: Choose from 4 corner positions
Clean design: Minimal, non-intrusive table format
Real-time updates: Always shows the latest ATR value
Adjustable period: Default 14-period, fully customizable
🎯 Perfect For:
Position sizing calculations
Stop-loss placement (1x, 1.5x, 2x ATR)
Volatility assessment at a glance
Clean chart setups without extra panels
Quick reference during live trading
📊 How to Use:
Add to chart
Select your preferred table position
Adjust ATR period if needed (default: 14)
The current ATR value displays automatically
💡 Pro Tip:
Use this ATR value to:
Set stop-losses at 1.5x or 2x ATR distance
Determine position size based on account risk
Compare current volatility to historical levels
Clean charts, clear data, better trading decisions.
Compatible with all timeframes and instruments. Pine Script v6.
Feel free to adjust this description to match your style or add any specific features you want to highlight!

IPDA with Order Blocks [Enhanced]Summary of the Code
This script plots IPDA Standard Deviations on a price chart, helping traders visualize potential support and resistance levels based on a series of user-defined deviations. It uses swing high/low points and time-based fractal lookbacks (monthly, weekly, daily, or intraday) to define price anchors and compute deviation lines.
Key features include:
Deviations: It calculates and plots deviation levels based on the distance between swing highs and lows, which traders can use as price targets or zones of interest.
Timeframes:
Monthly (higher timeframe analysis)
Weekly (medium-term analysis)
Daily and Intraday (shorter-term precision)
Customization:
Choose which deviation levels (e.g., 0, 1, -1, -2) to display.
Hide labels or adjust their sizes for cleaner charts.
Option to remove invalidated deviation levels dynamically.
Visual Cleanliness: Automatically removes clutter by hiding or deleting invalid deviation levels and focusing on active price zones.
How to Utilize It for Intraday Trading to Make $1,000
Here’s how to effectively use the indicator to optimize intraday trading:
1. Set the Right Timeframe:
Use the 15-minute or 1-hour chart for intraday setups.
Ensure the "Intraday" lookback option is enabled to focus on shorter-term swings.
2. Interpret the Levels:
Bearish Order Blocks: Look for red lines (bearish deviation) as potential resistance zones where the price may reverse downward.
Bullish Order Blocks: Look for green lines (bullish deviation) as potential support zones where the price may bounce upward.
3. Plan Entries and Exits:
Entry: Buy near a green order block or short near a red order block, confirming the trade with additional signals (e.g., candlestick patterns, momentum indicators).
Stop Loss: Place your stop below the green line (for buys) or above the red line (for shorts).
Profit Targets: Use deviation levels as targets (e.g., from the 0 level to +1 or -1).
4. Combine with Market Context:
Use the script alongside volume profile, trend indicators, or news events for confirmation.
Avoid trading during major news events unless aligned with deviations.
5. Position Sizing for $1,000 Goal:
Trade liquid instruments like Nasdaq futures (NQ) or major forex pairs.
Risk 1-2% of your capital on each trade and scale into positions if confirmed.
Target a profit of 10-20 points per trade on Nasdaq futures, with 1-2 trades daily.
6. Monitor Key Timeframes:
Pre-market (before 9:30 AM EST): Mark deviation levels to predict market open behavior.
Midday & Power Hour (3-4 PM EST): Watch for breakouts or retests around key deviation levels.
By combining this tool with disciplined risk management and a clear trading plan, you can systematically work toward your profit target while minimizing unnecessary risks

[blackcat] L1 Net Volume DifferenceOVERVIEW
The L1 Net Volume Difference indicator serves as an advanced analytical tool designed to provide traders with deep insights into market sentiment by examining the differential between buying and selling volumes over precise timeframes. By leveraging these volume dynamics, it helps identify trends and potential reversal points more accurately, thereby supporting well-informed decision-making processes. The key focus lies in dissecting intraday changes that reflect short-term market behavior, offering critical input for both swing and day traders alike. 📊
Key benefits encompass:
• Precise calculation of net volume differences grounded in real-time data.
• Interactive visualization elements enhancing interpretability effortlessly.
• Real-time generation of buy/sell signals driven by dynamic volume shifts.
TECHNICAL ANALYSIS COMPONENTS
📉 Volume Accumulation Mechanisms:
Monitors cumulative buy/sell volumes derived from comparative closing prices.
Periodically resets accumulation counters aligning with predefined intervals (e.g., 5-minute bars).
Facilitates identification of directional biases reflecting underlying market forces accurately.
🕵️♂️ Sentiment Detection Algorithms:
Employs proprietary logic distinguishing between bullish/bearish sentiments dynamically.
Ensures consistent adherence to predefined statistical protocols maintaining accuracy.
Supports adaptive thresholds adjusting sensitivities based on changing market conditions flexibly.
🎯 Dynamic Signal Generation:
Detects transitions indicating dominance shifts between buyers/sellers promptly.
Triggers timely alerts enabling swift reactions to evolving market dynamics effectively.
Integrates conditional logic reinforcing signal validity minimizing erroneous activations.
INDICATOR FUNCTIONALITY
🔢 Core Algorithms:
Utilizes moving averages along with standardized deviation formulas generating precise net volume measurements.
Implements Arithmetic Mean Line Algorithm (AMLA) smoothing techniques improving interpretability.
Ensures consistent alignment with established statistical principles preserving fidelity.
🖱️ User Interface Elements:
Dedicated plots displaying real-time net volume markers facilitating swift decision-making.
Context-sensitive color coding distinguishing positive/negative deviations intuitively.
Background shading highlighting proximity to key threshold activations enhancing visibility.
STRATEGY IMPLEMENTATION
✅ Entry Conditions:
Confirm bullish/bearish setups validated through multiple confirmatory signals.
Validate entry decisions considering concurrent market sentiment factors.
Assess alignment between net volume readings and broader trend directions ensuring coherence.
🚫 Exit Mechanisms:
Trigger exits upon hitting predetermined thresholds derived from historical analyses.
Monitor continuous breaches signifying potential trend reversals promptly executing closures.
Execute partial/total closes contingent upon cumulative loss limits preserving capital efficiently.
PARAMETER CONFIGURATIONS
🎯 Optimization Guidelines:
Reset Interval: Governs responsiveness versus stability balancing sensitivity/stability.
Price Source: Dictates primary data series driving volume calculations selecting relevant inputs accurately.
💬 Customization Recommendations:
Commence with baseline defaults; iteratively refine parameters isolating individual impacts.
Evaluate adjustments independently prior to combined modifications minimizing disruptions.
Prioritize minimizing erroneous trigger occurrences first optimizing signal fidelity.
Sustain balanced risk-reward profiles irrespective of chosen settings upholding disciplined approaches.
ADVANCED RISK MANAGEMENT
🛡️ Proactive Risk Mitigation Techniques:
Enforce strict compliance with pre-defined maximum leverage constraints adhering strictly to guidelines.
Mandatorily apply trailing stop-loss orders conforming to script outputs reinforcing discipline.
Allocate positions proportionately relative to available capital reserves managing exposures prudently.
Conduct periodic reviews gauging strategy effectiveness rigorously identifying areas needing refinement.
⚠️ Potential Pitfalls & Solutions:
Address frequent violations arising during heightened volatility phases necessitating manual interventions judiciously.
Manage false alerts warranting immediate attention avoiding adverse consequences systematically.
Prepare contingency plans mitigating margin call possibilities preparing proactive responses effectively.
Continuously assess automated system reliability amidst fluctuating conditions ensuring seamless functionality.
PERFORMANCE AUDITS & REFINEMENTS
🔍 Critical Evaluation Metrics:
Assess win percentages consistently across diverse trading instruments gauging reliability.
Calculate average profit ratios per successful execution measuring profitability efficiency accurately.
Measure peak drawdown durations alongside associated magnitudes evaluating downside risks comprehensively.
Analyze signal generation frequencies revealing hidden patterns potentially skewing outcomes uncovering systematic biases.
📈 Historical Data Analysis Tools:
Maintain comprehensive records capturing every triggered event meticulously documenting results.
Compare realized profits/losses against backtested simulations benchmarking actual vs expected performances accurately.
Identify recurrent systematic errors demanding corrective actions implementing iterative refinements steadily.
Document evolving performance metrics tracking progress dynamically addressing identified shortcomings proactively.
PROBLEM SOLVING ADVICE
🔧 Frequent Encountered Challenges:
Unpredictable behaviors emerging within thinly traded markets requiring filtration processes.
Latency issues manifesting during abrupt price fluctuations causing missed opportunities.
Overfitted models yielding suboptimal results post-extensive tuning demanding recalibrations.
Inaccuracies stemming from incomplete/inaccurate data feeds necessitating verification procedures.
💡 Effective Resolution Pathways:
Exclude low-liquidity assets prone to erratic movements enhancing signal integrity.
Introduce buffer intervals safeguarding major news/event impacts mitigating distortions effectively.
Limit ongoing optimization attempts preventing model degradation maintaining optimal performance levels consistently.
Verify reliable connections ensuring uninterrupted data flows guaranteeing accurate interpretations reliably.
USER ENGAGEMENT SEGMENT
🤝 Community Contributions Welcome
Highly encourage active participation sharing experiences & recommendations!
THANKS
Heartfelt acknowledgment extends to all developers contributing invaluable insights about volume-based trading methodologies! ✨

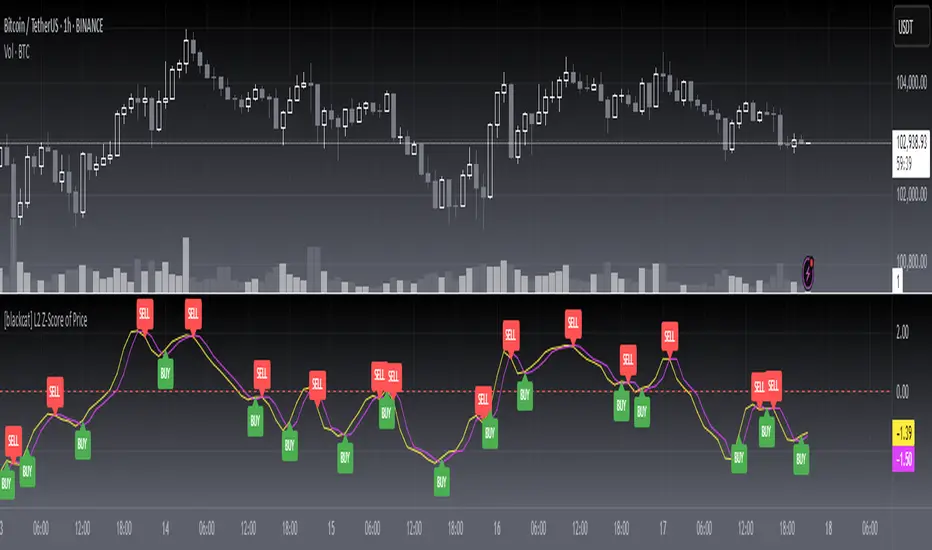
[blackcat] L2 Z-Score of PriceOVERVIEW
The L2 Z-Score of Price indicator offers traders an insightful perspective into how current prices diverge from their historical norms through advanced statistical measures. By leveraging Z-scores, it provides a robust framework for identifying potential reversals in financial markets. The Z-score quantifies the number of standard deviations that a data point lies away from the mean, thus serving as a critical metric for recognizing overbought or oversold conditions. 🎯
Key benefits encompass:
• Precise calculation of Z-scores reflecting true price deviations.
• Interactive plotting features enhancing visual clarity.
• Real-time generation of buy/sell signals based on crossover events.
STATISTICAL ANALYSIS COMPONENTS
📉 Mean Calculation:
Utilizes Simple Moving Averages (SMAs) to establish baseline price references.
Provides smooth representations filtering short-term noise preserving long-term trends.
Fundamental for deriving subsequent deviation metrics accurately.
📈 Standard Deviation Measurement:
Quantifies dispersion around established means revealing underlying variability.
Crucial for assessing potential volatility levels dynamically adapting strategies accordingly.
Facilitates precise Z-score derivations ensuring statistical rigor.
🕵️♂️ Z-SCORE DETECTION:
Measures standardized distances indicating relative positions within distributions.
Helps pinpoint extreme conditions signaling impending reversals proactively.
Enables early identification of trend exhaustion phases prompting timely actions.
INDICATOR FUNCTIONALITY
🔢 Core Algorithms:
Integrates SMAs along with standardized deviation formulas generating precise Z-scores.
Employs Arithmetic Mean Line Algorithm (AMLA) smoothing techniques improving interpretability.
Ensures consistent adherence to predefined statistical protocols maintaining accuracy.
🖱️ User Interface Elements:
Dedicated plots displaying real-time Z-score markers facilitating swift decision-making.
Context-sensitive color coding distinguishing positive/negative deviations intuitively.
Background shading highlighting proximity to key threshold activations enhancing visibility.
STRATEGY IMPLEMENTATION
✅ Entry Conditions:
Confirm bullish/bearish setups validated through multiple confirmatory signals.
Validate entry decisions considering concurrent market sentiment factors.
Assess alignment between Z-score readings and broader trend directions ensuring coherence.
🚫 Exit Mechanisms:
Trigger exits upon hitting predetermined thresholds derived from historical analyses.
Monitor continuous breaches signifying potential trend reversals promptly executing closures.
Execute partial/total closes contingent upon cumulative loss limits preserving capital efficiently.
PARAMETER CONFIGURATIONS
🎯 Optimization Guidelines:
Length: Governs responsiveness versus smoothing trade-offs balancing sensitivity/stability.
Price Source: Dictates primary data series driving Z-score computations selecting relevant inputs accurately.
💬 Customization Recommendations:
Commence with baseline defaults; iteratively refine parameters isolating individual impacts.
Evaluate adjustments independently prior to combined modifications minimizing disruptions.
Prioritize minimizing erroneous trigger occurrences first optimizing signal fidelity.
Sustain balanced risk-reward profiles irrespective of chosen settings upholding disciplined approaches.
ADVANCED RISK MANAGEMENT
🛡️ Proactive Risk Mitigation Techniques:
Enforce strict compliance with pre-defined maximum leverage constraints adhering strictly to guidelines.
Mandatorily apply trailing stop-loss orders conforming to script outputs reinforcing discipline.
Allocate positions proportionately relative to available capital reserves managing exposures prudently.
Conduct periodic reviews gauging strategy effectiveness rigorously identifying areas needing refinement.
⚠️ Potential Pitfalls & Solutions:
Address frequent violations arising during heightened volatility phases necessitating manual interventions judiciously.
Manage false alerts warranting immediate attention avoiding adverse consequences systematically.
Prepare contingency plans mitigating margin call possibilities preparing proactive responses effectively.
Continuously assess automated system reliability amidst fluctuating conditions ensuring seamless functionality.
PERFORMANCE AUDITS & REFINEMENTS
🔍 Critical Evaluation Metrics:
Assess win percentages consistently across diverse trading instruments gauging reliability.
Calculate average profit ratios per successful execution measuring profitability efficiency accurately.
Measure peak drawdown durations alongside associated magnitudes evaluating downside risks comprehensively.
Analyze signal generation frequencies revealing hidden patterns potentially skewing outcomes uncovering systematic biases.
📈 Historical Data Analysis Tools:
Maintain comprehensive records capturing every triggered event meticulously documenting results.
Compare realized profits/losses against backtested simulations benchmarking actual vs expected performances accurately.
Identify recurrent systematic errors demanding corrective actions implementing iterative refinements steadily.
Document evolving performance metrics tracking progress dynamically addressing identified shortcomings proactively.
PROBLEM SOLVING ADVICE
🔧 Frequent Encountered Challenges:
Unpredictable behaviors emerging within thinly traded markets requiring filtration processes.
Latency issues manifesting during abrupt price fluctuations causing missed opportunities.
Overfitted models yielding suboptimal results post-extensive tuning demanding recalibrations.
Inaccuracies stemming from incomplete/inaccurate data feeds necessitating verification procedures.
💡 Effective Resolution Pathways:
Exclude low-liquidity assets prone to erratic movements enhancing signal integrity.
Introduce buffer intervals safeguarding major news/event impacts mitigating distortions effectively.
Limit ongoing optimization attempts preventing model degradation maintaining optimal performance levels consistently.
Verify reliable connections ensuring uninterrupted data flows guaranteeing accurate interpretations reliably.
USER ENGAGEMENT SEGMENT
🤝 Community Contributions Welcome
Highly encourage active participation sharing experiences & recommendations!
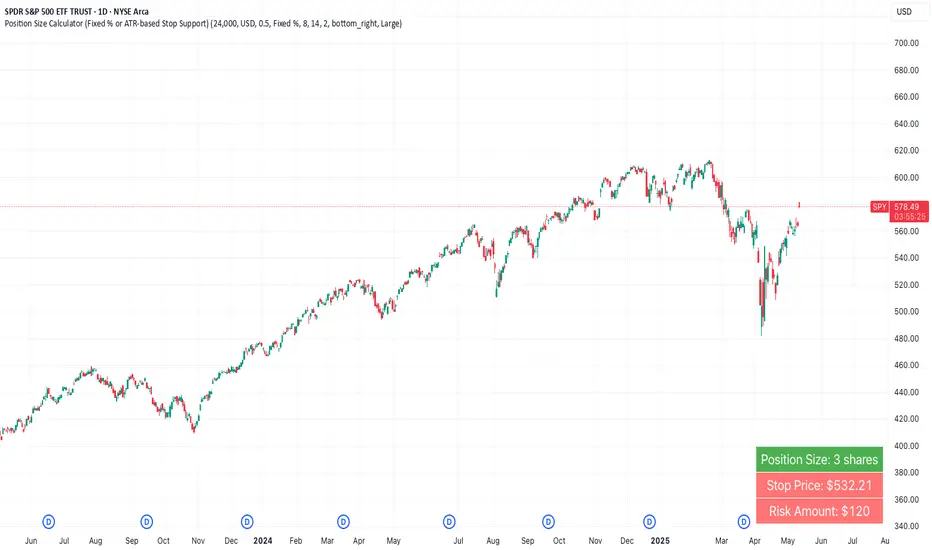
Position Size Calculator (Fixed % or ATR-based Stop Support)Position Size Calculator (Fixed % or ATR-based Stop Support)
Purpose and Background
This indicator allows traders to calculate appropriate position sizes directly on the chart, based on a key rule:
“What percentage of your capital are you willing to risk per trade?”
While many traders focus on entries and indicators, position sizing and risk allocation are often overlooked.
This tool visualizes and simplifies the “1% risk rule” promoted by IBD (Investor’s Business Daily) and William J. O’Neil, helping both beginners and experienced traders maintain disciplined capital management.
Key Features
Automatically calculates and displays:
・ Position Size
The number of units (shares, contracts, coins) you can hold based on your stop-loss range and risk allowance.
・ Stop Price
The price level at which your stop-loss would be triggered.
・ Risk Amount
The maximum loss per trade based on your portfolio size and risk percentage.
Two stop-loss modes available:
・ Fixed % Mode
O’Neil suggests using up to 8% stop-loss in uptrends and keeping it tighter (around 4%) in corrections. This mode allows flexible manual settings.
・ ATR-Based Mode
Uses the asset’s average volatility to dynamically calculate stop-loss width using the Average True Range (ATR).
ATR Usage and Recommended Settings
ATR helps you avoid noise-based stop-outs and align your risk with market volatility.
There are two parameters you can adjust:
・ ATR Length
Defines how many bars are used to calculate the average range.
・Shorter values (5–10) respond faster for day trades
・Longer values (14–21) offer smoother ranges for swing/position trades(Default is 14)
・ATR Multiplier
Sets how wide the stop-loss is by multiplying the ATR value:
・Day trading: 1.0–1.5×
・Swing trading: 1.5–2.5×
・Position trading: 2.0–3.0×
Practical Examples: Risk % × Stop-Loss % → Max Positions
This tool helps estimate how many positions you can hold in a portfolio based on your risk per trade and stop width.
Examples:
・Risk 0.5%, Stop 8% → Max 16 positions
・Risk 0.5%, Stop 4% → Max 8 positions
・Risk 1.0%, Stop 8% → Max 8 positions
・Risk 1.0%, Stop 4% → Max 4 positions
・Risk 2.0%, Stop 8% → Max 4 positions
・Risk 2.0%, Stop 4% → Max 2 positions
These assume worst-case scenarios where all positions are stopped out simultaneously within your overall portfolio risk limit.
Display & Customization Options
・ Currency Display: USD or JPY
No currency conversion is applied. Select based on your trading region (e.g., USD for U.S. stocks, JPY for Japanese stocks).
Support for additional currencies can be added upon request.
・ Show/Hide Decimal Places
Toggle decimals for better visibility. Ideal for fractional assets like crypto and CFDs.
・ Position of Output
Choose from top-right, middle-right, or bottom-right on the chart.
・ Text Display Size: Large / Normal / Small
Choose the table size that best suits your viewing preferences.
・ Explanation of Displayed Labels
・ Position Size : Units to buy/sell based on risk
・ Stop Price : Price where stop-loss is triggered
・ Risk Amount : Max loss allowed for the trade
How to Use
1、Set your Portfolio Size
2、Choose your Currency (USD or JPY)
3、Input Risk per Trade (%) (e.g., 1%)
4、Select Stop Loss Method
・ Fixed % : Enter a manual stop-loss percent (e.g., 8%)
・ ATR : Then also enter:
・ ATR Length : Number of bars used to calculate ATR (e.g., 14)
・ ATR Multiplier : Factor applied to ATR to determine stop-loss (e.g., 2.0)
5、Adjust decimals, label position, or text size as needed
6、The result is displayed in a table directly on your chart
Notes
・ Uses the current close price (close) as the basis
Real-time bid/ask data isn't available in Pine Script, so the close price is used for consistent results.
・ No buy/sell signals are generated
This tool is for position sizing and risk calculation only, not trade entries.
Recommended For
・Traders who want precise, rule-based position sizing
・Users following IBD or O’Neil’s 1% risk principle
・Those incorporating ATR for stop-loss strategies
・Multi-asset traders (stocks, crypto, CFDs, etc.)
・ Anyone who wants to calculate position size and risk without using a calculator or external tool—fully inside TradingView
Dynamic Liquidity Depth [BigBeluga]
Dynamic Liquidity Depth
A liquidity mapping engine that reveals hidden zones of market vulnerability. This tool simulates where potential large concentrations of stop-losses may exist — above recent highs (sell-side) and below recent lows (buy-side) — by analyzing real price behavior and directional volume. The result is a dynamic two-sided volume profile that highlights where price is most likely to gravitate during liquidation events, reversals, or engineered stop hunts.
🔵 KEY FEATURES
Two-Sided Liquidity Profiles:
Plots two separate profiles on the chart — one above price for potential sell-side liquidity , and one below price for potential buy-side liquidity . Each profile reflects the volume distribution across binned zones derived from historical highs and lows.
Real Stop Zone Simulation:
Each profile is offset from the current high or low using an ATR-based buffer. This simulates where traders might cluster their stop-losses above swing highs (short stops) or below swing lows (long stops).
Directional Volume Analysis:
Buy-side volume is accumulated only from bullish candles (close > open), while sell-side volume is accumulated only from bearish candles (close < open). This directional filtering enhances accuracy by capturing genuine pressure zones.
Dynamic Volume Heatmap:
Each liquidity bin is rendered as a horizontal box with a color gradient based on volume intensity:
- Low activity bins are shaded lightly.
- High-volume zones appear more vividly in red (sell) or lime (buy).
- The maximum volume bin in each profile is emphasized with a brighter fill and a volume label.
Extended POC Zones:
The Point of Control (PoC) — the bin with the most volume — is extended backwards across the entire lookback period to mark critical resistance (sell-side) or support (buy-side) levels.
Total Volume Summary Labels:
At the center of each profile, a summary label displays Total Buy Liquidity and Total Sell Liquidity volume.
This metric helps assess directional imbalance — when buy liquidity is dominant, the market may favor upward continuation, and vice versa.
Customizable Profile Granularity:
You can fine-tune both Resolution (Bins) and Offset Distance to adjust how far profiles are displaced from price and how many levels are calculated within the ATR range.
🔵 HOW IT WORKS
The indicator calculates an ATR-based buffer above highs and below lows to define the top and bottom of the liquidity zones.
Using a user-defined lookback period, it scans historical candles and divides the buffered zones into bins.
Each bin checks if bullish (or bearish) candles pass through it based on price wicks and body.
Volume from valid candles is summed into the corresponding bin.
When volume exists in a bin, a horizontal box is drawn with a width scaled by relative volume strength.
The bin with the highest volume is highlighted and optionally extended backward as a zone of importance.
Total buy/sell liquidity is displayed with a summary label at the side of the profile.
🔵 USAGE/b]
Identify Stop Hunt Zones: High-volume clusters near swing highs/lows are likely liquidation zones targeted during fakeouts.
Fade or Follow Reactions: Price hitting a high-volume bin may reverse (fade opportunity) or break with strength (confirmation breakout).
Layer with Other Tools: Combine with market structure, order blocks, or trend filters to validate entries near liquidity.
Adjust Offset for Sensitivity: Use higher offset to simulate wider stop placement; use lower for tighter scalping zones.
🔵 CONCLUSION
Dynamic Liquidity Depth transforms raw price and volume into a spatial map of liquidity. By revealing areas where stop orders are likely hidden, it gives traders insight into price manipulation zones, potential reversal levels, and breakout traps. Whether you're hunting for traps or trading with the flow, this tool equips you to navigate liquidity with precision.

Guppy Multiple Moving Average (GMMA)The GMMA Momentum Indicator plots 12 EMAs on your chart, divided into two groups:
Short-term EMAs (6 lines, default periods: 3, 5, 8, 10, 12, 15): Represent short-term trader sentiment and momentum.
Long-term EMAs (6 lines, default periods: 30, 35, 40, 45, 50, 60): Reflect long-term investor behavior and broader market trends.
By analyzing the interaction between these two groups, the indicator identifies:
Bullish and bearish trends based on the relative positions of the short- and long-term EMAs.
Momentum strength through the spread or convergence of the EMAs.
Potential reversals or breakouts via compression signals.
This PineScript version enhances the traditional GMMA by adding visual cues like background colors, bearish signals, and compression detection, making it ideal for swing traders seeking clear, actionable insights.
The GMMA Momentum Indicator provides several key features:
1. Trend Identification
Bullish Trend: When the short-term EMAs (green lines) are above the long-term EMAs (blue lines) and spreading apart, it signals strong upward momentum. The chart background turns light green to highlight this condition.
Bearish Trend: When the short-term EMAs cross below the long-term EMAs and converge, it indicates downward momentum. The background turns light red, and an orange downward triangle appears above the bar to mark a new bearish signal.
2. Momentum Analysis
The spread between the short-term EMAs reflects the strength of short-term momentum. A wide spread suggests strong momentum, while a tight grouping indicates weakening momentum or consolidation. Similarly, the long-term EMAs act as dynamic support or resistance, guiding traders on the broader trend.
3. Compression Detection
Compression occurs when both the short-term and long-term EMAs converge, signaling low volatility and a potential breakout or reversal. A yellow upward triangle appears below the bar when compression is detected, alerting traders to watch for price action.
4. Visual Cues
Green short-term EMAs: Show short-term trader activity.
Blue long-term EMAs: Represent long-term investor sentiment.
Background colors: Light green for bullish trends, light red for bearish trends, and transparent for neutral conditions.
Orange downward triangles: Mark new bearish trends.
Yellow upward triangles: Indicate compression, hinting at potential breakouts.
How to Use the GMMA Momentum Indicator for Swing Trading
Swing trading involves capturing price moves over days to weeks, and the GMMA Momentum Indicator is an excellent tool for this strategy. Here’s how to use it effectively:
1. Identifying Trade Entries
Buy Opportunities:
Look for a bullish trend (green background) where the short-term EMAs are above the long-term EMAs and spreading apart, indicating strong momentum.
A compression signal (yellow triangle) followed by a breakout above resistance or a bullish candlestick pattern can confirm an entry.
Example: On a daily chart, if the short-term EMAs cross above the long-term EMAs and the background turns green, consider entering a long position, especially if volume supports the move.
Sell Opportunities:
Watch for a bearish signal (orange downward triangle) or a bearish trend (red background) where the short-term EMAs cross below the long-term EMAs.
Example: If the short-term EMAs collapse below the long-term EMAs and an orange triangle appears, it may signal a shorting opportunity or a time to exit longs.
2. Managing Trades
Use the long-term EMAs as dynamic support (in uptrends) or resistance (in downtrends) to set stop-loss levels or trail stops.
Monitor the spread of the short-term EMAs. A widening spread suggests the trend is strong, while convergence may indicate it’s time to take profits or tighten stops.
3. Anticipating Reversals
Compression signals (yellow triangles) highlight periods of low volatility, often preceding significant price moves. Combine these with price action (e.g., breakouts or reversals) or other indicators (e.g., RSI or volume) for confirmation.
Example: If a compression signal appears near a key support level and the price breaks upward, it could signal the start of a new bullish swing.
4. Best Practices
Timeframes: The indicator works well on daily or 4-hour charts for swing trading, but you can adjust the EMA periods for shorter (e.g., 1-hour) or longer (e.g., weekly) timeframes.
Confirmation: Combine the GMMA with other tools like support/resistance levels, candlestick patterns, or oscillators (e.g., MACD) to reduce false signals.
Risk Management: Always use proper position sizing and stop-losses, as EMAs are lagging indicators and may produce delayed signals in choppy markets.

OA - PowerZones Support And ResistancePowerZones - Dynamic Support/Resistance Identifier
Overview
PowerZones is an advanced technical analysis tool that automatically detects significant support and resistance zones using volume data and pivot points. This indicator pulls data from higher timeframes (weekly by default) to help you identify strong and meaningful levels that are filtered from short-term "noise."
Features
Multi-Timeframe Analysis: Create support/resistance levels from daily, weekly, or monthly data
Volume Filtering: Detect high-volume pivot points to identify more reliable levels
Dynamic Threshold: Volume filter that automatically adjusts to market conditions
Visual Clarity: Support/resistance zones are displayed as boxes with adjustable transparency
Optimal Level Selection: Filter out close levels to focus on the most significant support/resistance points
Use Cases
Entry/Exit Points: Identify trading opportunities at important support and resistance levels
Stop-Loss Placement: Use natural support levels to set more effective stop-losses
Target Setting: Use potential resistance levels as profit-taking targets
Understanding Market Structure: Detect long-term support/resistance zones to better interpret price movement
Input Parameters
Lookback Period: The period used to determine pivot points
Box Width : Adjusts the width of support/resistance zones
Relative Volume Period: The period used for relative volume calculation
Maximum Number of Boxes: Maximum number of support/resistance zones to display on the chart
Box Transparency: Transparency value for the boxes
Timeframe: Timeframe to use for support/resistance detection (Daily, Weekly, Monthly)
How It Works
PowerZones identifies pivot highs and lows in the selected timeframe. It filters these points using volume data to show only meaningful and strong levels. The indicator also consolidates nearby levels, allowing you to focus only on the most important zones on the chart.
Best Practices
Weekly timeframe setting is ideal for identifying long-term important support/resistance levels
Working with weekly levels on a daily chart allows you to combine long-term levels with short-term trades
ATR-based box width creates support/resistance zones that adapt to market volatility
Use the indicator along with other technical indicators such as RSI, MACD, or moving averages to confirm trading signals
Note: Like all technical indicators, this indicator does not guarantee 100% accuracy. Always apply risk management principles and use it in conjunction with other analysis methods to achieve the best results.
If you like the PowerZones indicator, please show your support by giving it a star and leaving a comment!

Ultimate MA & PSAR [TARUN]Overview
This indicator combines a customizable Moving Average (MA) and Parabolic SAR (PSAR) to generate precise long and short trade signals. A dashboard displays real-time trade conditions, including signal direction, entry price, stop loss, and PnL tracking.
Key Features
✅ Customizable MA Type & Period – Choose between SMA or EMA with adjustable length.
✅ Adaptive PSAR Settings – Modify start, increment, and max step values to fine-tune stop levels.
✅ Trade Signal Logic – Identifies potential buy (long) and sell (short) opportunities based on:
Price action relative to MA
MA trend direction (rising or falling)
PSAR confirmation
✅ Dynamic Stop Loss Calculation – Uses lowest low/highest high over a specified period for stop loss placement.
✅ Trade State & Reversal Handling – Manages active trades, pending signals, and stop loss exits dynamically.
✅ PnL & Dashboard Table – Displays real-time signal status, entry price, stop loss, and profit/loss (PnL) in an easy-to-read format.
How It Works
1.Buy (Long) Condition:
MA is rising
Price is above the MA
PSAR is below price
2.Sell (Short) Condition:
MA is falling
Price is below the MA
PSAR is above price
3.Stop Loss Handling:
For long trades → stop loss is set at the lowest low of the last X candles
For short trades → stop loss is set at the highest high of the last X candles
4.Trade Execution & PnL Calculation:
If a valid long/short setup is detected, a pending signal is placed.
On the next bullish (for long) or bearish (for short) candle, the trade is confirmed.
Real-time PnL updates help track trade performance.
Customization Options
🔹 Moving Average: SMA or EMA, adjustable period
🔹 PSAR Settings: Start, Increment, Maximum step values
🔹 Stop Loss Lookback: Choose how many candles to consider for stop loss placement
🔹 Dashboard Positioning: Select preferred display location (top/bottom, left/right)
🔹 Trade Signal Selection: Enable/Disable Long and Short signals individually
How to Use
Add the indicator to your chart.
Customize the MA & PSAR settings according to your trading strategy.
Follow the dashboard signals for trade setups.
Use stop loss levels to manage risk effectively.
Disclaimer
⚠️ This indicator is for educational purposes only and does not constitute financial advice. Always perform proper risk management and backtesting before using it in live trading.

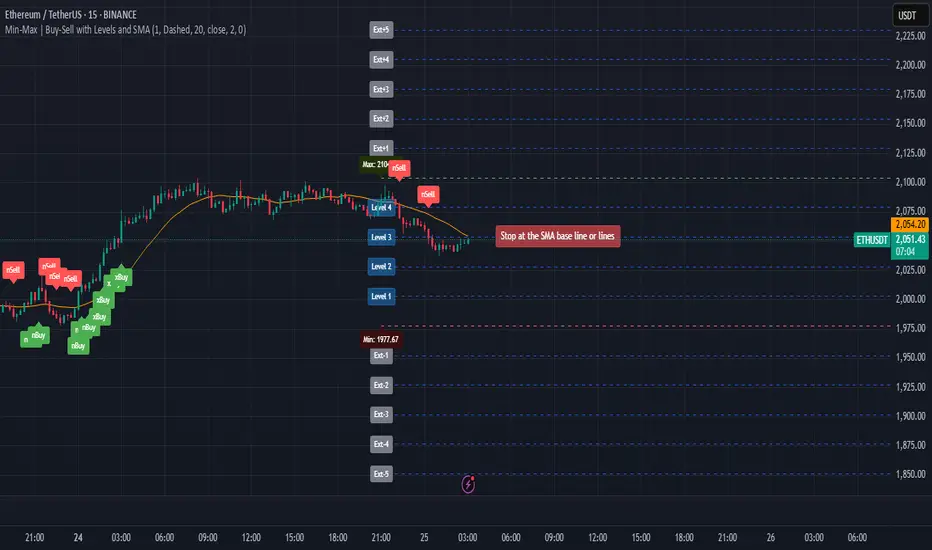
Min-Max | Buy-Sell Alert with LevelsMin-Max | Buy-Sell Alert with Levels
Description:
The Min-Max | Buy-Sell Alert with Levels indicator is a powerful tool designed to help traders identify key levels of support and resistance based on the previous day's high and low prices. It plots horizontal lines for the previous day's minimum (Min) and maximum (Max) prices, along with four intermediate levels (Stop Loss 1 to Stop Loss 4) calculated as equal percentage steps between the Min and Max.
This indicator is perfect for traders who want to:
Identify potential entry points when the price returns within the Min-Max range.
Set stop-loss levels based on the calculated intermediate levels.
Receive alerts for buy, sell, and stop-loss conditions.
Key Features:
Previous Day's Min and Max Lines:
Automatically plots the Min (red line) and Max (green line) of the previous day.
These levels act as dynamic support and resistance zones.
Intermediate Stop Loss Levels:
Calculates and plots four intermediate levels (Stop Loss 1 to Stop Loss 4) between the Min and Max.
Each level is equally spaced, representing potential stop-loss or take-profit zones.
Customizable Alerts:
Buy Alert: Triggered when the price returns within the Min-Max range after breaking below the Min.
Sell Alert: Triggered when the price returns within the Min-Max range after breaking above the Max.
Stop Loss Alerts: Triggered when the price reaches any of the four intermediate levels (Stop Loss 1 to Stop Loss 4).
Customizable Appearance:
Adjust the thickness, color, and style (solid, dashed, dotted) of the lines.
Customize the colors of the Stop Loss labels for better visualization.
Labels on the Chart:
Displays "Buy" and "Sell" labels on the chart when the respective conditions are met.
Labels for Stop Loss levels are also displayed for easy reference.
How to Use:
Add the indicator to your chart.
Customize the settings (line colors, thickness, and alert preferences) in the indicator's settings panel.
Use the Min and Max lines as dynamic support and resistance levels.
Monitor the intermediate levels (Stop Loss 1 to Stop Loss 4) for potential stop-loss or take-profit zones.
Set up alerts for Buy, Sell, and Stop Loss conditions to stay informed about key price movements.
Why Use This Indicator?
Simple and Effective: Focuses on the most important levels from the previous day.
Customizable: Tailor the indicator to match your trading style and preferences.
Alerts: Never miss a trading opportunity with customizable alerts for key conditions.
Settings:
Line Thickness: Adjust the thickness of the Min, Max, and intermediate lines.
Line Colors: Customize the colors of the Min, Max, and intermediate lines.
Line Style: Choose between solid, dashed, or dotted lines.
Stop Loss Label Colors: Customize the colors of the Stop Loss labels.
Alerts: Enable or disable alerts for Buy, Sell, and Stop Loss conditions.
Ideal For:
Day traders and swing traders.
Traders who rely on support and resistance levels.
Anyone looking for a clear and customizable tool to identify key price levels.
Disclaimer:
This indicator is for educational and informational purposes only. It does not constitute financial advice. Always conduct your own analysis and trade responsibly.
Get Started Today!
Add the Min-Max | Buy-Sell Alert with Levels indicator to your chart and take your trading to the next level. Customize it to fit your strategy and never miss a key trading opportunity again!